Google Analytics is an amazing tool.
It allows you to find out how visitors are interacting with your site. We install it on every website that Blue Zoo Creative builds. This tool offers a wealth of information that you can use to improve the number and experience of visitors to your site.
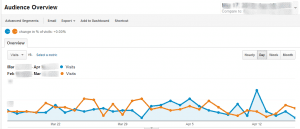
The first thing you see when you visit Google Analytics is a graph of how many people have visited your site (the blue line). It’s best to add a point of reference by comparing it to last month (the orange line). The default comparison is the previous month. If you have more than a years worth of data, comparing against the same month last year is a better option. This will eliminate seasonal effects so that you see increases or decreases versus the same month last year.
The key metrics you see on almost all of the pages are as follows:
- Visits
- Pageviews
- Pages/Visit
- Avg. Visit Duration
- % New Visits
- Unique Visitors
- Bounce Rate
Visits are what people normally think of as “hits” on the site. It is a count of how many individual people visit the site. Google Analytics is pretty smart and filters out junk visits from bots or people hitting the reload button repeatedly. This gives you a more realistic number of visits.
Pageviews are the total number of pages that visitors have viewed on the site. It can also be thought of as “hits” as well. If someone is talking to you about the number of “hits” they receive on their site, ask to make sure you know which of these metrics they’re referring to.
Pages/Visit is the intersection of the previous two metrics. It is simply the number of pages/divided by the number of visits. It is a metric of how engaging the site is. Once a visitor shows up, how many clicks on pages did they make? If you see this metric increasing over time, you know you’re doing a good job with site navigation and interesting content.
Avg. Visit Duration is another measure of engagement. It shows in minutes how long a visitor stays on the site. This is a good supplement to the Pages/Visit metric. If your site has long articles, high pages/visit, but shrinking avg. visit duration, it could mean that visitors are quickly getting bored with your content and clicking to another part of the site. You might be able to retain them longer if you break your content into smaller posts.
Next time we’ll discuss some of the other metrics in Google Analytics such as % New Visits, Unique Visitors, and Bounce Rate.
If you want help with Google Analytics, please contact Blue Zoo Creative.

